Statistics Description
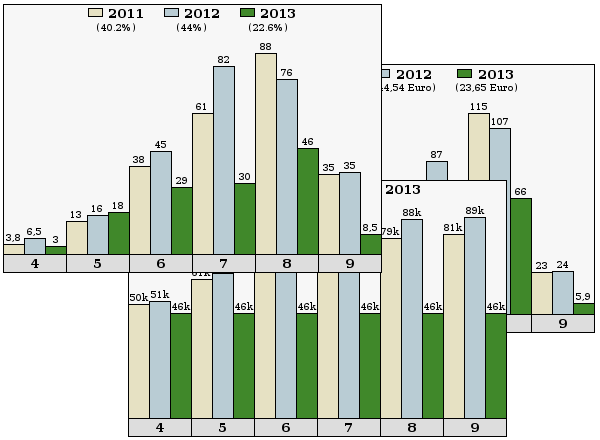
The statistics page provides various graphics that illustrate the trends of rooms/apartments occupancy and
of revenues linked to the structure reservations. Each graphic is divided by months and provides the average of all
months below the title. It's possible to compare the trends of various years, up to 5 contemporaneously, and for
each year it's possible to show only selected months. Furthermore it's possible to limit the results to a subgroup
of rooms by selecting a rate associated to them by assignment rule 2.
Between the various data provided by the graphics the is also the RevPAR, an indicator largely used in the
hotel industry, that represents the average daily revenue generated by each available room/apartment. The RevPAR
should be calculated on the base rate, without any extra cost, but in case you use hoteldruid extra costs to
calculate the base rate, then you'll be able to consult the graphic of the RevPAR calculated including extra
costs in rooms prices.
The last graphics are not divided by months as they represent respectively the number of reservations and
incomes divided by reservations origins and the incomes divided by payment methods.